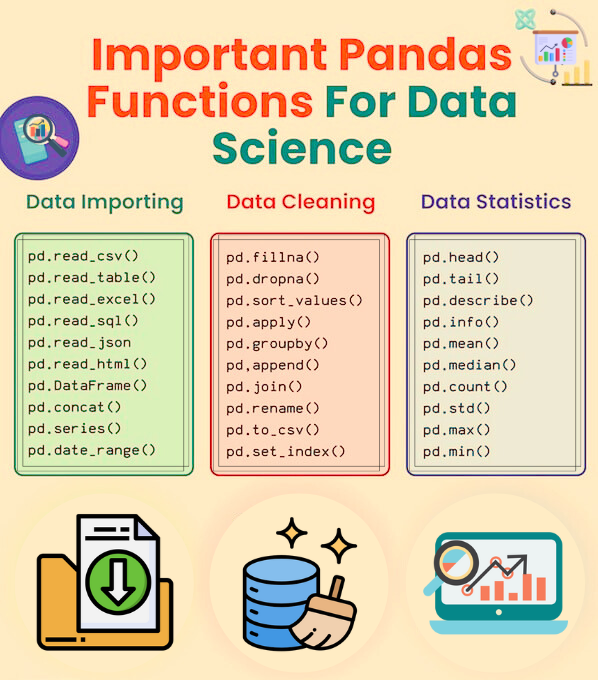
Here's a simple cheat sheet for working with Pandas functions in Data Science:
Basic Data Structures
Series: A one-dimensional labeled array capable of holding any data type.
import pandas as pd
s = pd.Series([3, -5, 7, 4], index=['a', 'b', 'c', 'd'])DataFrame: A two-dimensional labeled data structure with columns of potentially different types.
data = {'Country': ['Belgium', 'India', 'Brazil'], 'Capital': ['Brussels', 'New Delhi', 'Brasilia'], 'Population': [11190846, 1303171035, 207847528]}
df = pd.DataFrame(data, columns=['Country', 'Capital', 'Population'])
Data Manipulation
Selecting Data:
df['Country']  # Selects the 'Country' column
df.loc[:, 'Country':'Population']  # Selects a range of columns
Filtering Data:
python
Copy
df[df['Population'] > 10000000] # Filters rows where Population > 10000000Adding Data:
df['Area'] = [30528, 3287263, 8515767] # Adds a new column 'Area'Data Cleaning
Handling Missing Values:
df.fillna(0)  # Replaces missing values with 0
df.dropna()  # Drops rows with missing values
Dropping Columns:
df.drop(columns=['Area']) # Drops the 'Area' columnData Analysis
Descriptive Statistics:
df.describe() # Generates descriptive statisticsGrouping Data:
df.groupby('Country').sum() # Groups data by 'Country' and sums other columnsData Visualization
Plotting Data:
import matplotlib.pyplot as plt
df.plot(kind='bar', x='Country', y='Population')
plt.show()
Would you like more details on any specific function or feature? 🌟 If this is helpful to you, you can save it to favorites so you don't lose it!
