
At devs3.pro, we're always exploring ways to build efficient, powerful tools that don't sacrifice performance. When it comes to system monitoring, classics like htop are fantastic, but what if we could build our own, tailored exactly to our needs, with the speed and safety of a modern language? Enter Rust.
In this tutorial, we'll embark on a journey to create a sleek, real-time system monitor that runs directly in your terminal. This isn't just about replicating an existing tool; it's about understanding how to harness Rust's ecosystem to interact with the system and build a dynamic, responsive UI.
Why Rust for a System Monitor?
Before we dive into the code, let's address the "why." Rust is a natural fit for a system-level monitor for several reasons:
- Performance: It compiles to native code, offering C-like speed, which is crucial for real-time data polling.
- Memory Safety: Without a garbage collector, Rust guarantees memory safety at compile time, preventing a whole class of bugs in a long-running process.
- Fearless Concurrency: Easily and safely manage asynchronous tasks for polling different system metrics simultaneously.
- Rich Ecosystem: A vibrant crate ecosystem provides the building blocks we need.
The Architectural Blueprint
Our monitor will display key system metrics: CPU usage, memory consumption, and process list, all updating in real-time. To achieve this, we'll rely on a few key crates:
sysinfo: The workhorse for fetching system data. It's a cross-platform library that provides a unified API to query CPU, memory, disks, and processes.ratatui(formerlytui-rs): A fantastic library for building rich Terminal User Interfaces (TUIs). It abstracts away the low-level terminal details and provides a straightforward way to create layouts, charts, and lists.crossterm: A cross-platform terminal manipulation library thatratatuiuses under the hood. It handles raw mode, alternate screens, and event polling.
Building the Monitor: Step-by-Step
Let's break down the core components of our application.
1. Project Setup and Dependencies
Start a new Cargo project and add the necessary dependencies:
[package]
name = "rust-mon"
version = "0.1.0"
edition = "2021"

[dependencies]
sysinfo = "0.29"
ratatui = "0.23"
crossterm = "0.27"
2. The Core Application Loop
The heart of our application is a loop that continuously redraws the UI based on updated system information. We use crossterm to enter "raw mode," disabling line buffering and enabling the alternate screen for a clean, flicker-free experience.
use std::{io, time::Duration};
use crossterm::{
    event::{self, Event, KeyCode},
    terminal::{disable_raw_mode, enable_raw_mode, EnterAlternateScreen, LeaveAlternateScreen},
    ExecutableCommand,
};
use ratatui::{prelude::*, widgets::*};
use sysinfo::{System, SystemExt};

fn main() -> io::Result<()> {
    // Terminal initialization
    enable_raw_mode()?;
    io::stdout().execute(EnterAlternateScreen)?;
    let mut terminal = Terminal::new(CrosstermBackend::new(io::stdout()))?;

    // System information handle
    let mut sys = System::new_all();

    // Main application loop
    let mut should_quit = false;
    while !should_quit {
        // Refresh all system information
        sys.refresh_all();

        // Draw the UI
        terminal.draw(|frame| {
            let chunks = Layout::default()
                .direction(Direction::Vertical)
                .margin(1)
                .constraints([
                    Constraint::Length(3), // CPU
                    Constraint::Length(3), // Memory
                    Constraint::Min(0),    // Processes
                ])
                .split(frame.area());

            // 1. CPU Usage Widget
            let cpu_usage = sys.global_cpu_info().cpu_usage();
            let cpu_gauge = Gauge::default()
                .block(Block::default().title(" CPU ").borders(Borders::ALL))
                .gauge_style(Style::default().fg(Color::Cyan))
                .percent(cpu_usage as u16);
            frame.render_widget(cpu_gauge, chunks[0]);

            // 2. Memory Usage Widget
            let used_mem = sys.used_memory();
            let total_mem = sys.total_memory();
            let mem_ratio = (used_mem as f64 / total_mem as f64) * 100.0;
            let mem_gauge = Gauge::default()
                .block(Block::default().title(" Memory ").borders(Borders::ALL))
                .gauge_style(Style::default().fg(Color::Green))
                .percent(mem_ratio as u16);
            frame.render_widget(mem_gauge, chunks[1]);

            // 3. Process List Widget
            let processes: Vec<ListItem> = sys
                .processes()
                .values()
                .map(|proc| {
                    let line = format!(
                        "{:<8} {:.1}% {}",
                        proc.pid(),
                        proc.cpu_usage(),
                        proc.name()
                    );
                    ListItem::new(line)
                })
                .collect();
            let process_list = List::new(processes)
                .block(Block::default().title(" Processes ").borders(Borders::ALL))
                .highlight_style(Style::default().add_modifier(Modifier::REVERSED));
            frame.render_widget(process_list, chunks[2]);
        })?;

        // Handle user input (quit on 'q' or Ctrl-C)
        if event::poll(Duration::from_millis(250))? {
            if let Event::Key(key) = event::read()? {
                if key.code == KeyCode::Char('q') || key.code == KeyCode::Esc {
                    should_quit = true;
                }
            }
        }
    }

    // Cleanup and restore terminal
    disable_raw_mode()?;
    io::stdout().execute(LeaveAlternateScreen)?;
    Ok(())
}
3. Key Features Explained
- Real-time Updates: The loop runs every 250ms, calling
sys.refresh_all()to update thesysinfostruct with the latest data before redrawing. - Modular Layout:
ratatui'sLayoutsystem allows us to split the terminal into logical sections for different metrics, making the code clean and maintainable. - Visual Gauges: We use the
Gaugewidget for CPU and Memory, providing an intuitive, visual representation of usage. - Dynamic Process List: The process list is built on each iteration, showing the PID, CPU usage, and name of each running process.
Taking It Further
This basic monitor is just a starting point. The Rust ecosystem empowers you to extend it with powerful features:
- Disk I/O Monitoring: Use
sysinfoto also track read/write operations. - Network Statistics: Add a panel for network upload/download speeds.
- Custom Color Schemes: Define themes to match your terminal's aesthetic.
- Process Management: Implement functionality to kill processes by selecting them in the list.
- Historical Charts: Use
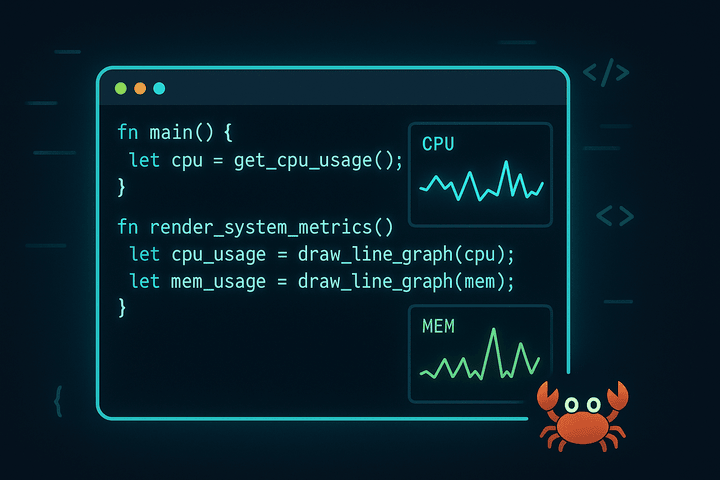
ratatui'sChartwidget to plot CPU or memory usage over time.
Conclusion
Building a system monitor in Rust is more than a fun project; it's a masterclass in practical systems programming. You get hands-on experience with asynchronous data polling, terminal control, and UI layout, all within the safe and performant confines of Rust. The sysinfo and ratatui crates do much of the heavy lifting, allowing you to focus on the logic and design of your tool.
We encourage you to use the code above as a foundation. Clone it, break it, and most importantly, build upon it. The terminal is a powerful canvas, and with Rust, you have the perfect set of brushes to paint your masterpiece.